Studio Canvas
The Studio Canvas is your main workspace for building, connecting, and testing AI agent workflows. You can drag components, wire them together, configure logic, and inspect behavior—all from one interface.
Core Features
| Feature | Purpose |
|---|---|
| Canvas Layout | Overview of interface zones and navigation |
| Menu Bar | Quick actions like copy, paste, delete, export, and search |
| Component Placement Guidelines | Placement rules and drop behavior |
| Building Workflows | Step-by-step guide to adding and connecting components |
| Deploying Agents | Move from draft to production safely |
| Monitoring and Debugging | Review execution, logs, and performance |
| Error Handling | Catch, alert, or recover from failures |
| Canvas Search | Quickly locate and jump to components or agents |
| Mobile Experience Warning | Understand how mobile device constraints affect the canvas UI |
Canvas Layout
When you open an agent in Studio, the screen is divided into three key areas:
- Left sidebar: Navigate tabs like Components, Agent Settings, Deployment History, Templates, and Vault.
- Canvas workspace: The visual editor where you arrange and connect components.
- Right sidebar: Configure individual components, test input/output, and inspect settings.
Menu Bar
Right-click anywhere on the canvas or a component to open the menu bar. It gives you quick access to common actions:
- Copy – Duplicate the selected component(s).
- Paste – Insert the copied component(s) into the canvas.
- Delete selected components – Remove the current selection.
- Disabled if no component is selected.
- Disabled if the selection includes system or meta nodes such as the Agent Card (non-deletable).
- Export agent – Download the agent in a shareable format.
- Search – Open the canvas search panel to locate components quickly.
Menu states
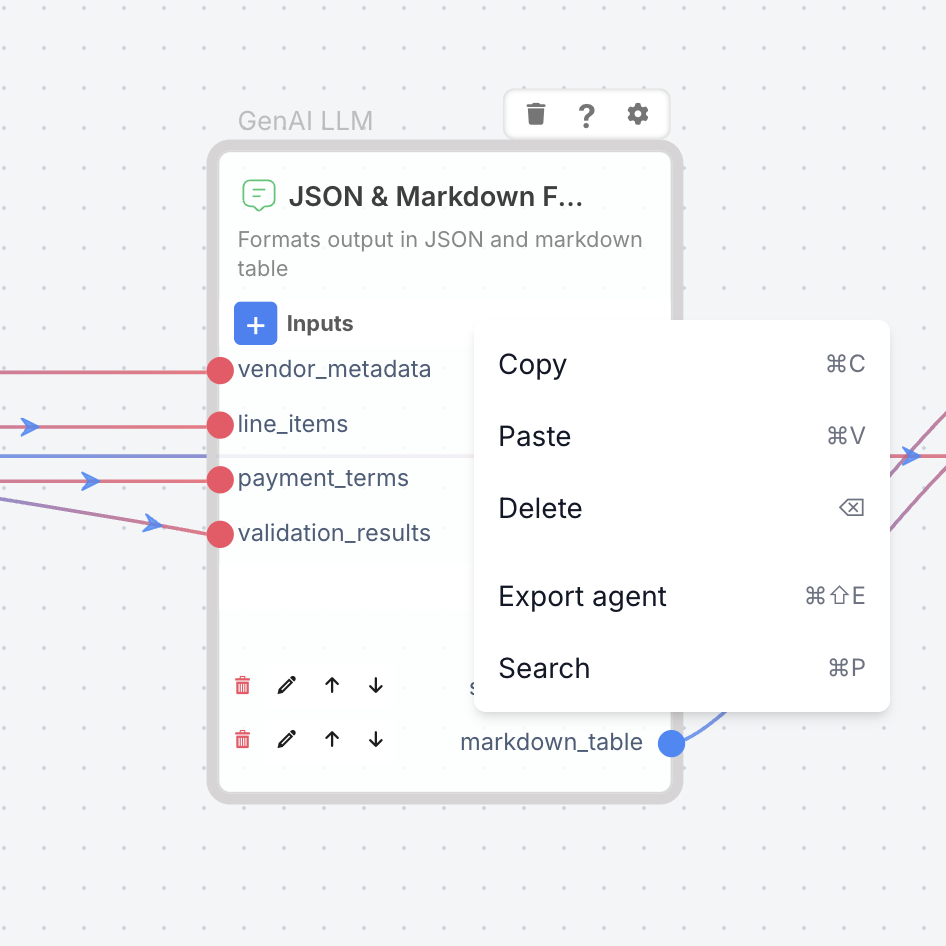
Menu with actions enabled when a component is selected.
Component Placement Guidelines
Valid Drop Zones
Components must be placed within the designated canvas area for proper functionality.
Invalid Placement Warning
When attempting to drop components outside the canvas area, you'll see:
- Warning Message: "Oops! you are dropping this component off the Canvas - please drop it inside"
- Behavior: The tooltip appears briefly and auto-dismisses
- Result: No component is added to the workflow
Building Workflows
You build workflows directly on the canvas by connecting reusable components. Each workflow defines how your agent processes input and produces a result.
- Drag components from the sidebar onto the canvas
- Connect output ports to input ports to pass data between steps
- Configure individual components in the right panel
Read the Building Workflows guide to explore advanced tips, trigger types, external integrations, and best practices for authoring AI workflows.
Deploying Agents
Once you’re satisfied with your workflow:
- Click Deploy in the top-right.
- Add release notes to describe the version.
- Confirm to push your agent to production.
- Use version history to roll back if needed.
Monitoring and Debugging
Inspect lets you preview and debug workflows without deploying.
- Component preview: Click any component to see inputs and outputs
- Run history: Review previous executions and filter by success/failure
- Logs view: Jump directly to detailed logs for each run
Need Production Logs? Visit Agent Logs for deeper visibility into executions.
Error Handling
You can define error handling for any step in your workflow—or globally.
Options include:
- Retry policies: Retry a component N times on failure
- Fallback paths: Provide defaults or cached data
- Notifications: Alert users via email or Slack
- Global error handler: Catch all uncaught errors at the workflow level
Canvas Search
The Canvas includes a built-in search that lets you instantly find and focus on components without manually scrolling or panning across large workflows. Search is scoped to the current canvas, so results only include items within the workflow you are editing.
Using Search
- Open the search menu from anywhere on the canvas (see Keyboard Shortcuts for the command).
- Type the name of the component or agent you are looking for.
- For example, if your GenAI LLM component is named Mood Analyser, you must search for Mood Analyser rather than just “GenAI LLM.”
- Matching results appear in a list that you can navigate with arrow keys or clicks.
- Selecting a result automatically centers and highlights it in the canvas view.
Mobile Experience
When accessing the SmythOS canvas on devices with screen widths smaller than 1024px, you’ll encounter a Mobile Experience Limited warning modal. This appears because the canvas interface relies on ample screen space for effective workflow building.
Small screens limit usability when:
- Arranging and wiring components
- Accessing input/output fields
- Configuring settings panels
For the best experience, use devices with screen widths of 1024px or larger.
Modal Options
The warning modal offers the following options:
- Copy Link to Desktop – Copies the current URL for opening on a desktop.
- Email Link to Myself – Sends the current canvas link to your registered email address.
- Continue Anyway – Dismisses the modal and allows limited use on mobile.
- Do Not Show Again – Hides the modal in future sessions on the same device.
Additional Resources
At the bottom of the modal:
- Documentation Link – Directs to relevant SmythOS docs.
- Contact Support Link – Opens an invite to the SmythOS Discord community.